Audio analysis with SuperVision
Using your ears is the single most important thing in audio production, mixing and mastering. But that doesn’t mean you can’t support your ears with visual tools. Particularly for less than ideal listening situations (let’s be honest, all of our studios) having visual tools can help tremendously to get a result that translates great on all systems.
I’m tempted to boldy state that visual analysis is underrated, but rather I’m going to state that visual analysis is often not properly understood. While we can all read a frequency graph, are terms like LUFS, PSR, Dynamic Range and phase coherence properly understood? And even if we can read the numbers, do we know what to change?
In this article I’ll explain my visual analysis preset in the Steinberg Cubase SuperVision plugin and touch upon potential actions I take based on what I see.
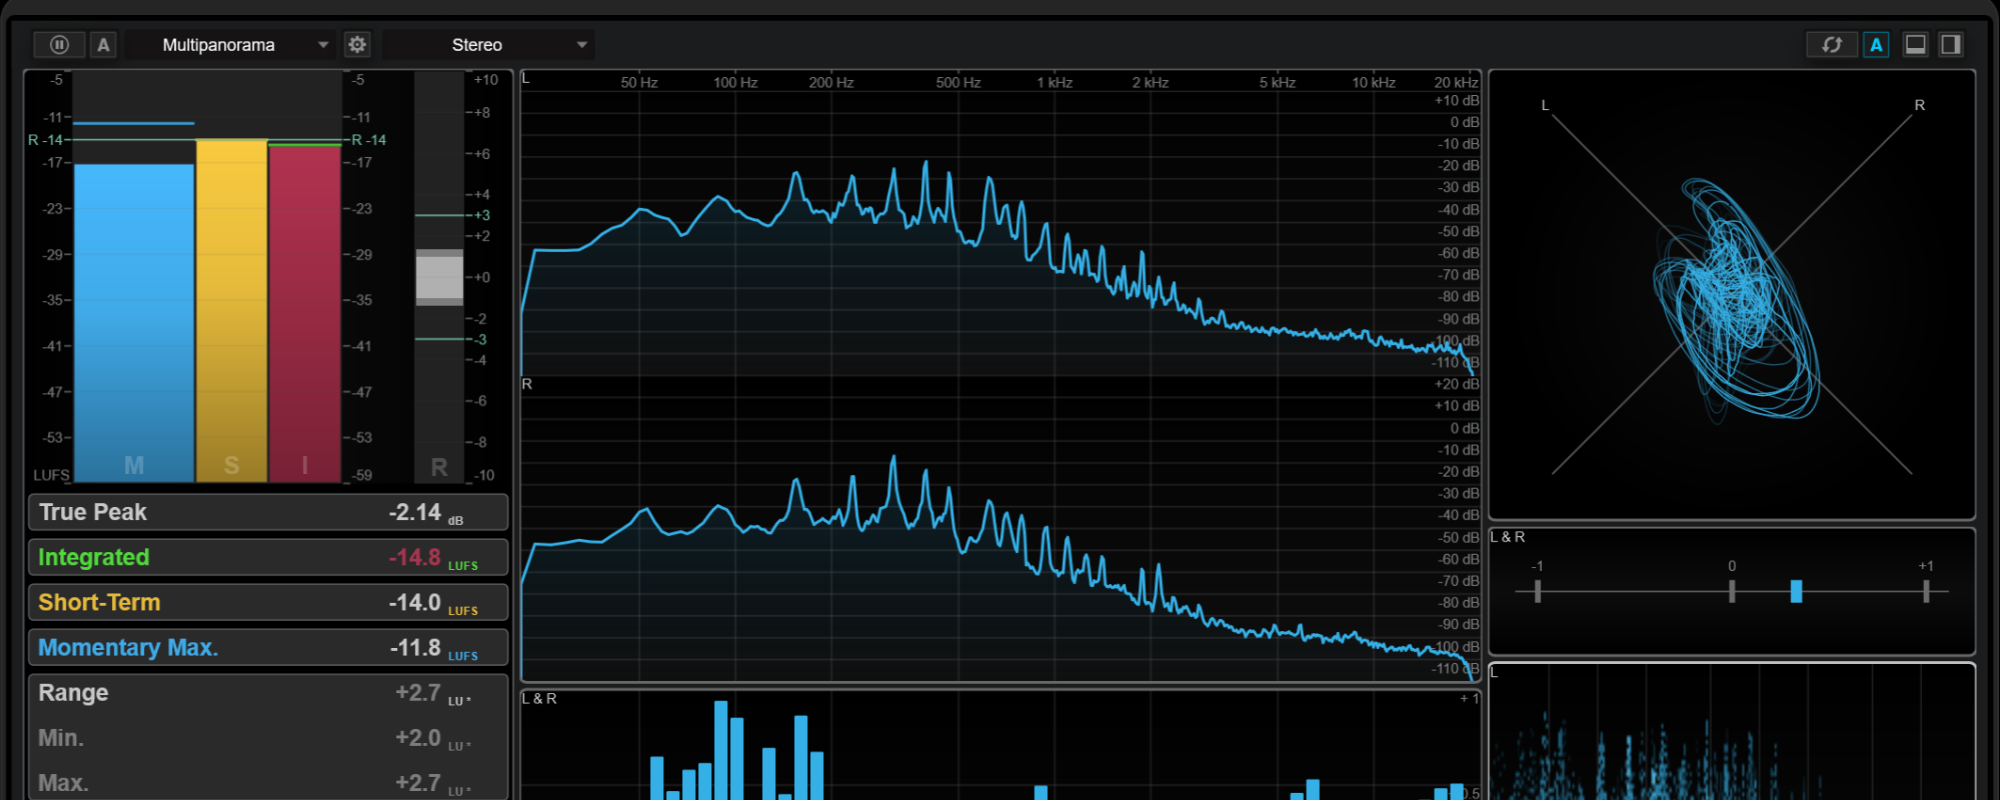
Let’s start with the most ‘basic’ metering section. Basic in quotation marks because it’s extremely informative and one of the main sections I am looking at all the time.
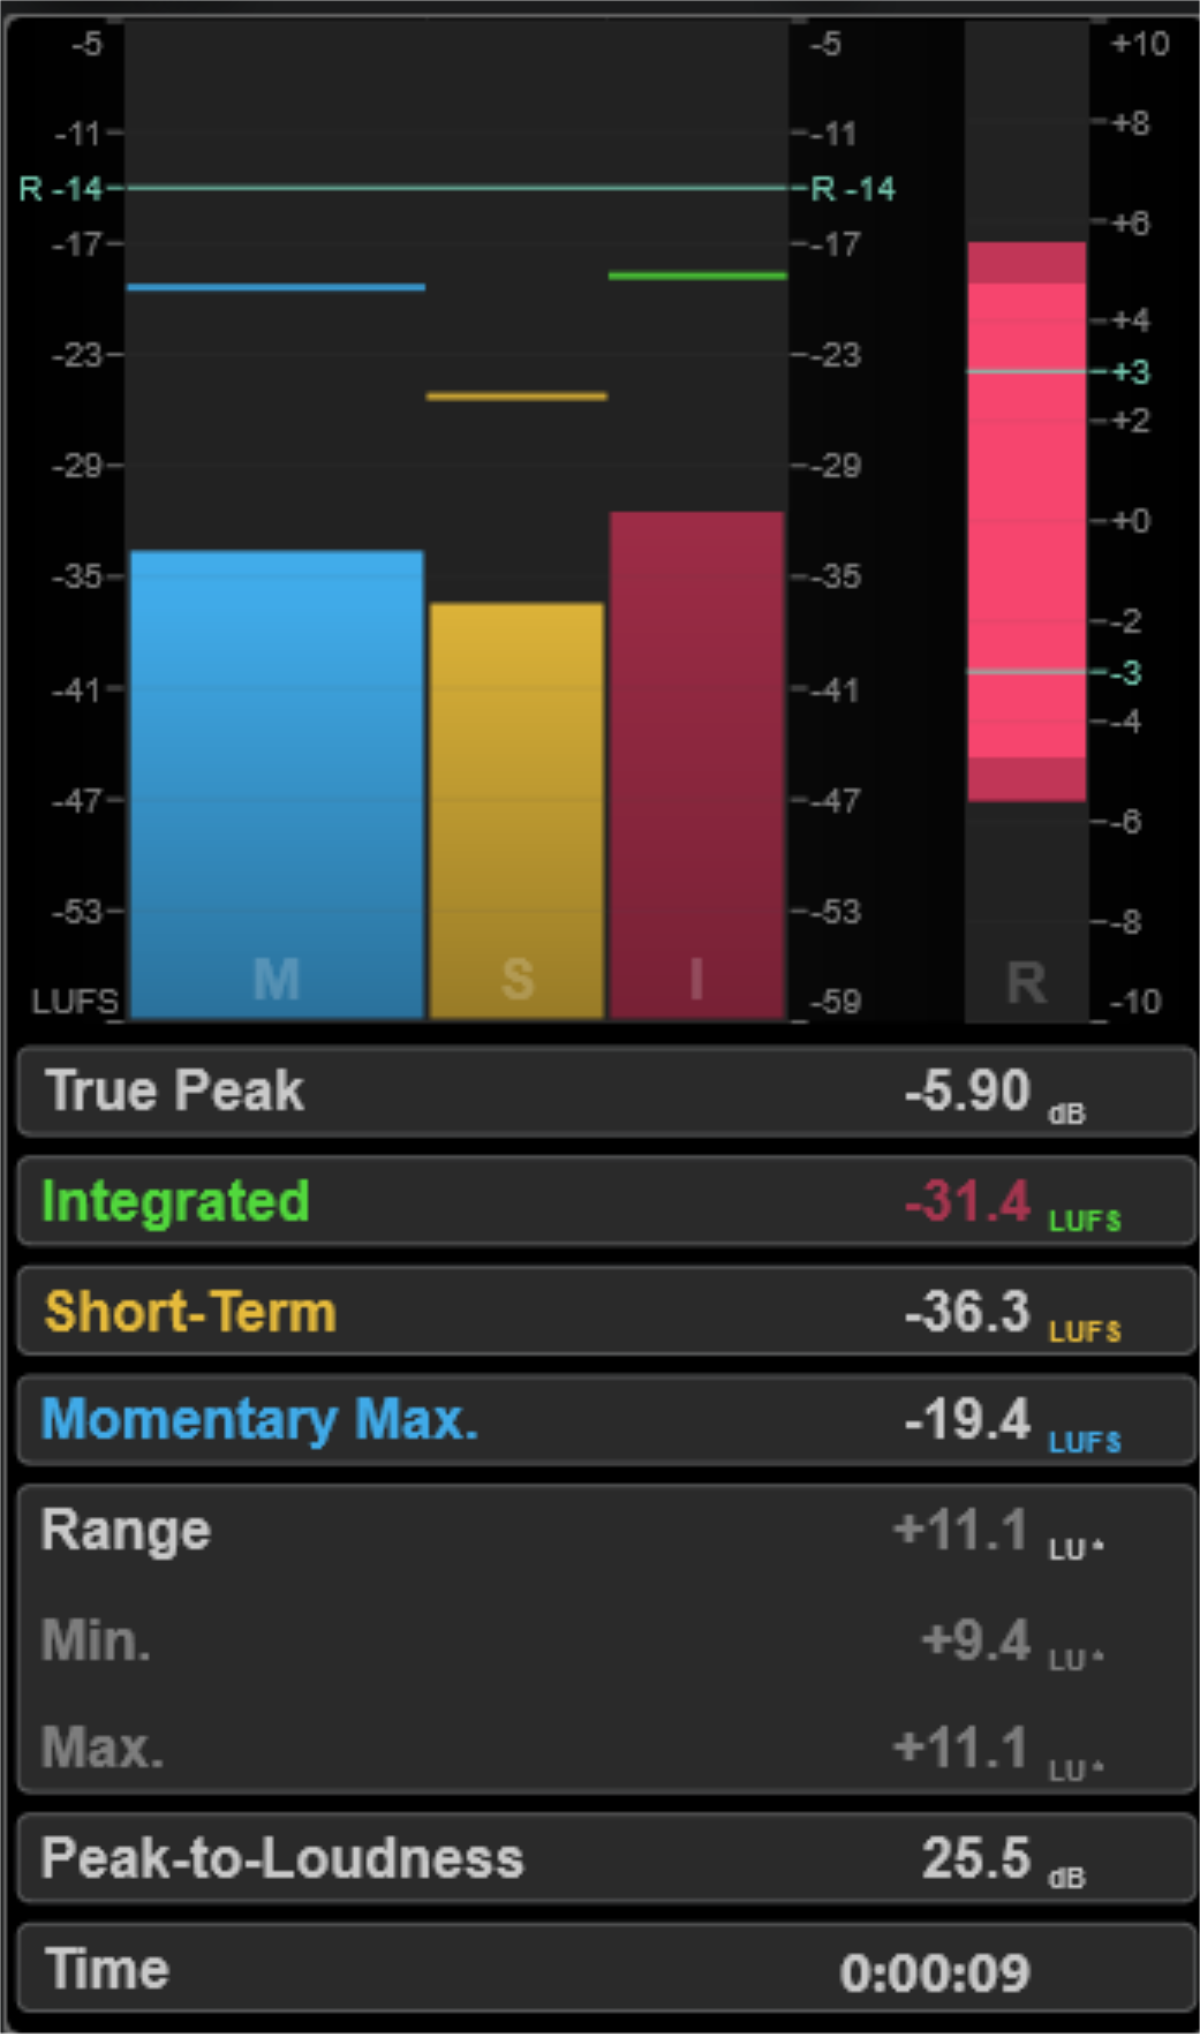
In the picture to the right there are 2 sections; the meters and measurements. They contain the same information, but in a different way. Let’s go through them one by one.
- True Peak: Shows the maximum true peak level in dB.
- Integrated: Shows the integrated loudness value. This is the average loudness value that is measured over the whole audio range LUFS.
- Short-Term: Shows the short-term loudness value that is measured every second on an audio block of 3 seconds in LU or LUFS.
- Momentary Max.: Shows the maximum value of all momentary loudness values that are measured every 100 ms in an audio range of 400 ms in LUFS.
- Range: Shows the loudness range (LRA) that is measured over the whole audio range in LU.
But what to look for? When is a number good or bad?
In the age of streaming the target loudness is set at -14 LUFS Integrated, with a True Peak of -1 dBFS. Strictly adhering to these numbers is a bit of a beginner mistake, because not much will happen if you go over these values. If your song is softer than -14 LUFS, your song is turned up and vice versa.
Turning up or down the volume won’t do much to the sound. However, if you don’t leave enough space for the True Peaks, the encoding might give artifacts. So it’s highly recommended to stick to a -1 dBFS True Peak. Even though major engineers don’t really stick to this rule either, some go as high as -0,1 dBFS, it’s a good practice to keep your True Peak at -1 dBFS.
A second thing to look at are the Short-Term and Momentary Max. numbers. They indicate the loudest peaks and allow you to know the loudness for segments of your song. It’s no problem for them to go over – 14 LUFS. However, depending on the genre you don’t want a big Dynamic Range as it impacts the overall loudness and listening experience. That’s where the Range comes in, but it depends on the genre you’re working on.
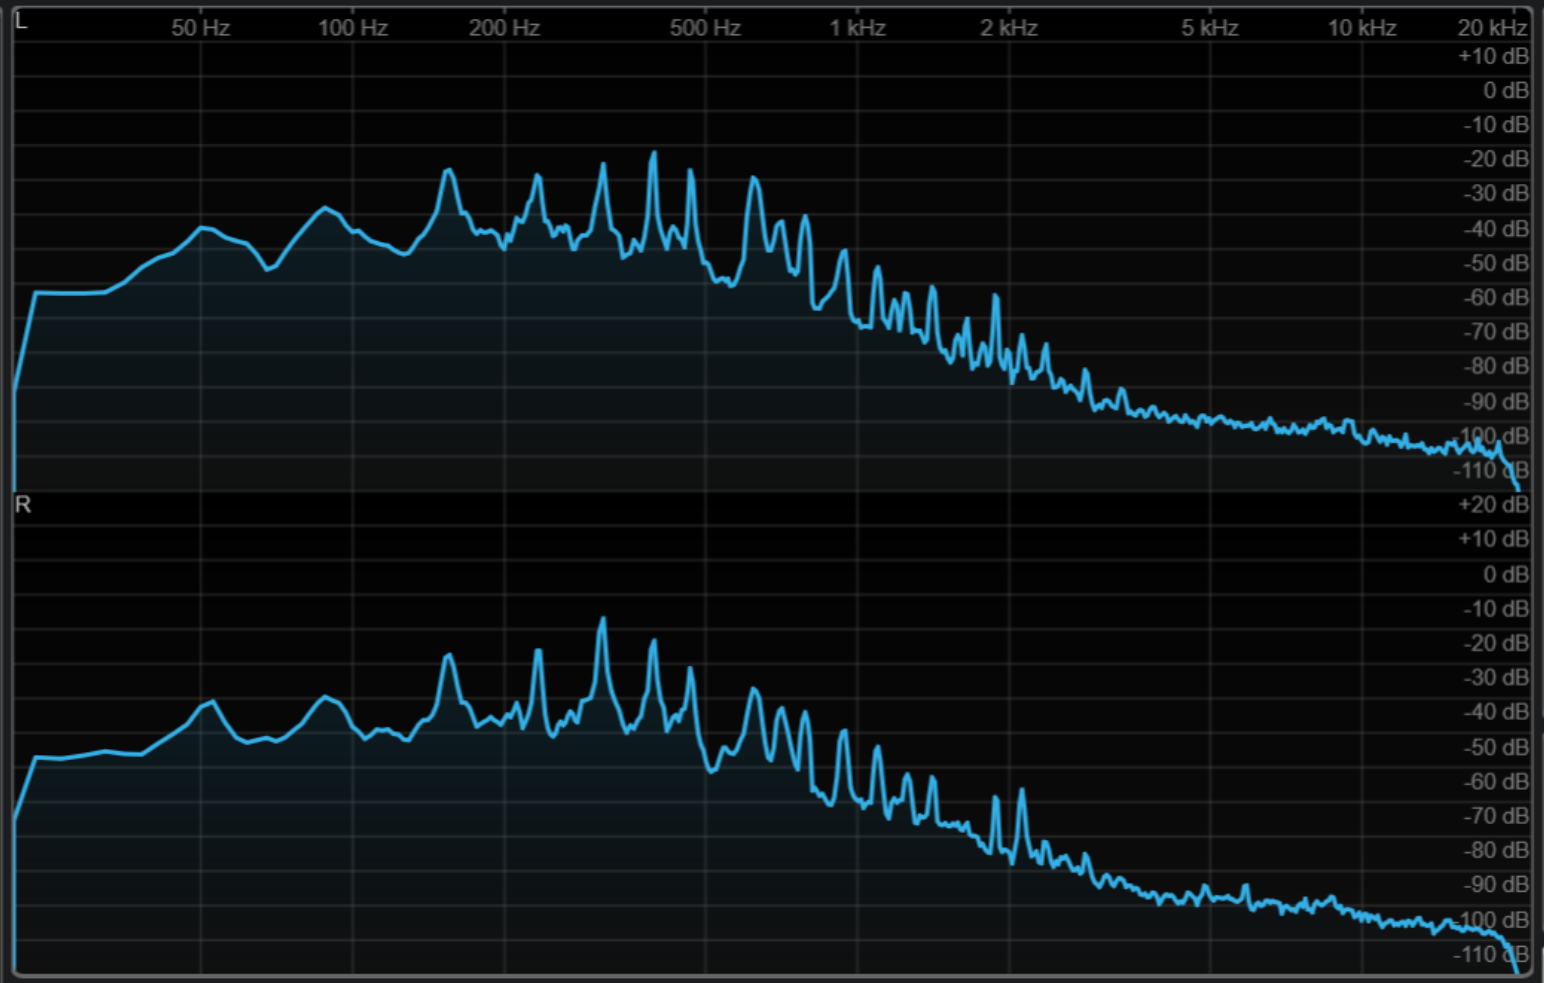
At the centre of my monitoring preset is the good old spectrum curve. It can highlight many problematic areas or reveal tonal imbalances. Knowing how to fix identified issues is another topic entirely. But a main way to go about it is to compare the spectrum curve of reference tracks with your song, that gives a good first start.
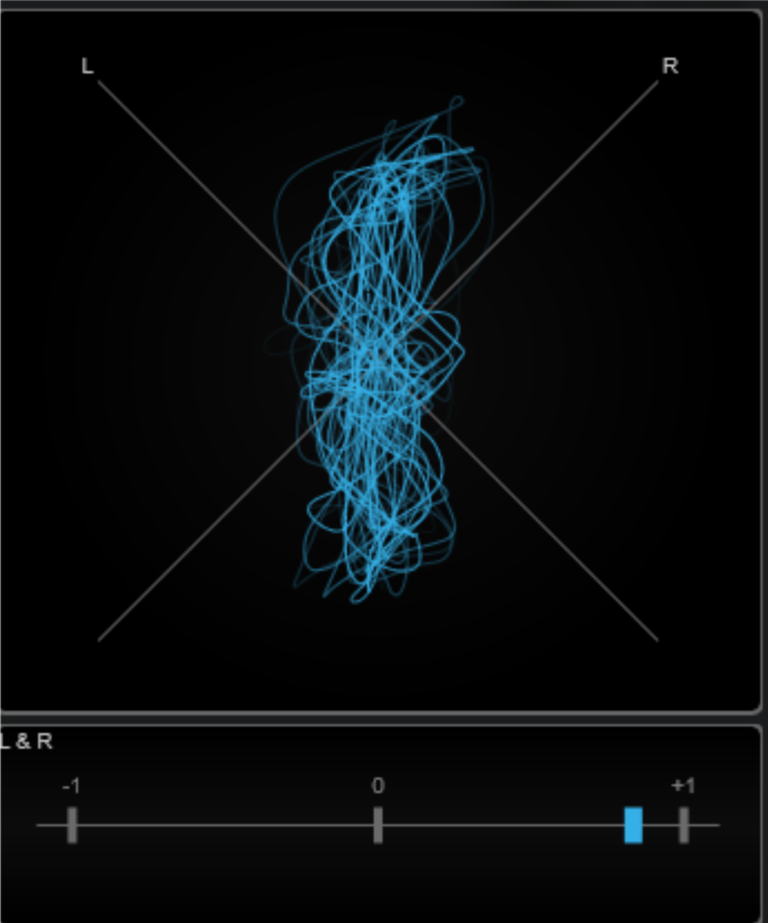
On the right hand of the screen is the stereofield section, with a vectorscope and left/right coherence indicator.
The vectorscope shows how the audio is occupying the stereo field. A thin vertical line means dead centre mono. A wide complex patterns means a wider sound. Logically, you’d want vocals or kicks to sit right in the centre and other instruments dancing around a bit. Try it out yourself and you’ll get a feel for it in no-time.
The L&R bar visualizes the phase-correlation between the left and the right channel where -1 is bad and +1 is good. This allows you, for example, to check the mono compatibility of a stereo recording. This is particularly useful when used in conjuction with the meters described below.
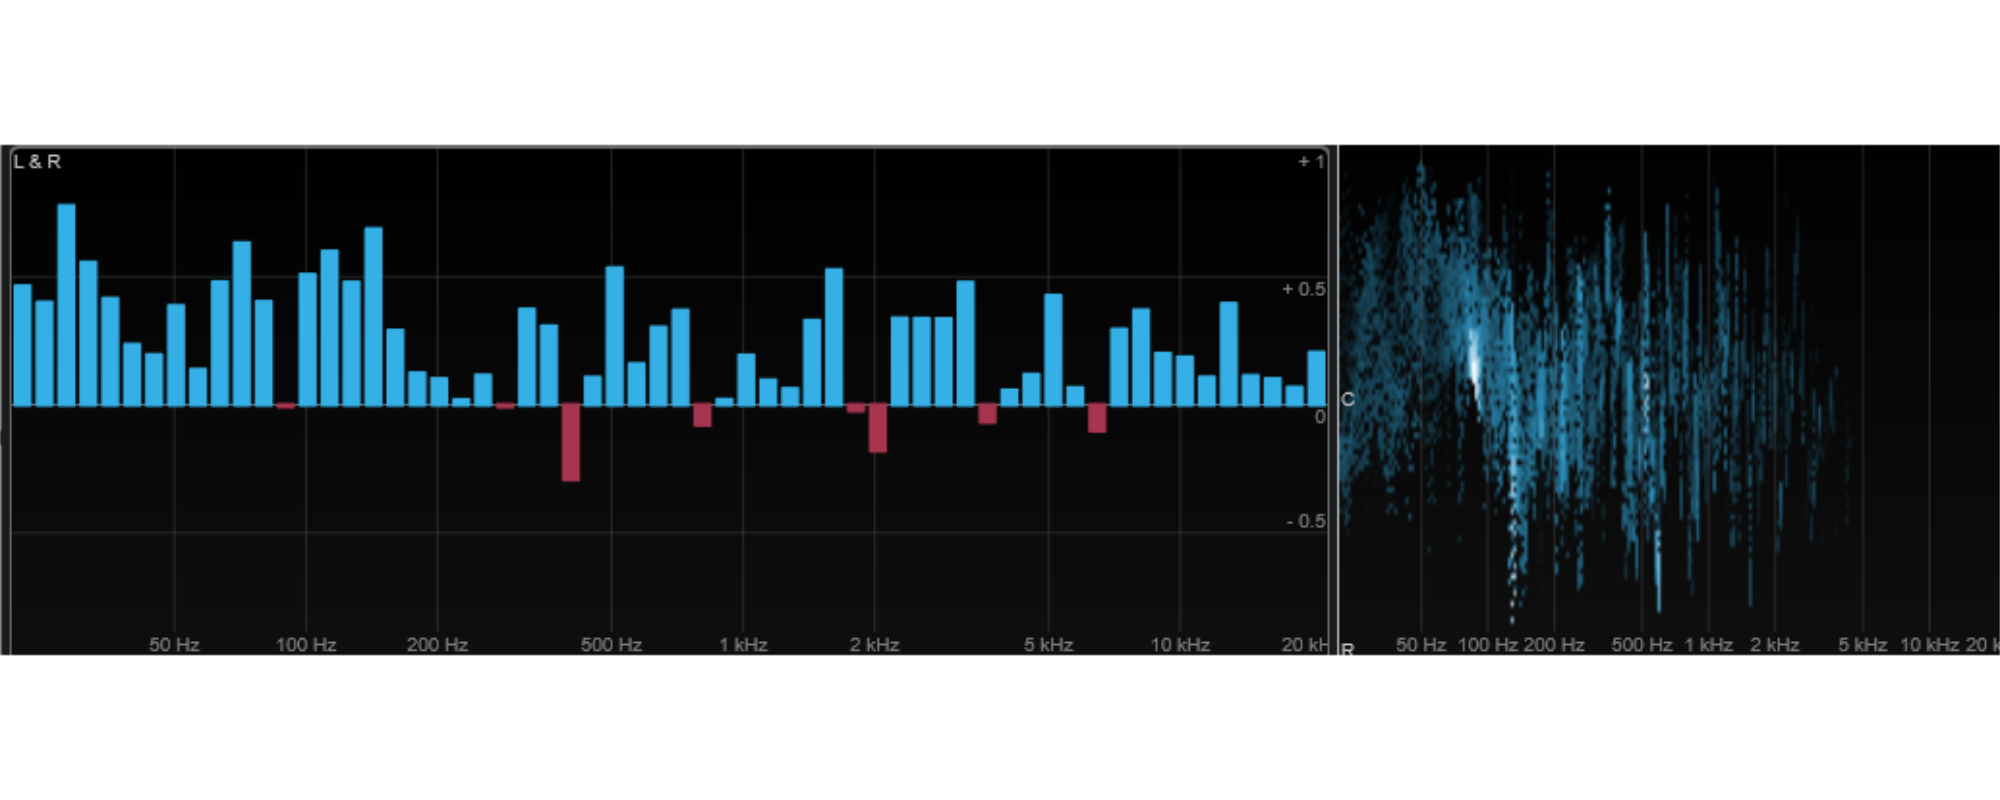
Both the multicorrelation graph (the bar chart) and the spectrum intensity (the horizontal christmas tree) help understand where and how there are phase issues.
In the images a recording of an acoustic piano is shown, where two microphones have been used that are placed quite far apart. It’s clearly readable that a key in the lower register is pressed, since there is a brighter white spot and the christmas tree is leaning upwards, meaning to the left. At the same time we can see that the lower frequencies are nicely in phase, as there are blue bars on the positive side (+1) of the correclation graph. The L&R bar on the image in the previous section also nicely displays nearly +1 correclation.
Based on the microphone placement, the problematic areas are around 500 Hz. Even when only playing in a lower register, you can see the correlation dip below 0 at a few spots, like around 500 Hz. A mitigating action could be to use EQ in mid-side mode and scoop away some of the side frequencies around 500 Hz. But always use your ears to listen if it’s actually problematic in mono. Otherwise, cutting 500 Hz could mean a weaker sound, while not actually making the sound better in mono.
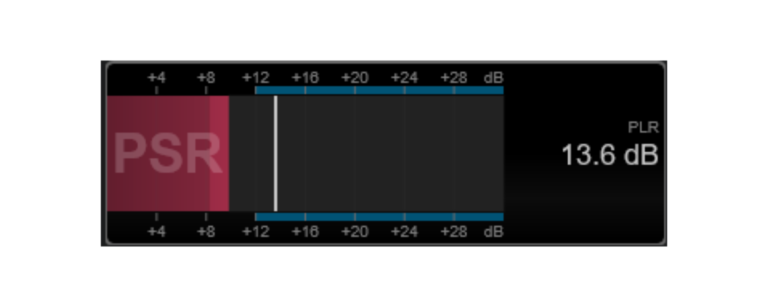
Lastly, there is the Peak to Loudness (PLR) and Peak to Short Term Loudness (PSR) ratio metering.
- PSR shows the ratio according to AES Convention e-Brief 373. The darker area of the meter indicates the minimum PSR value.
- PLR shows the peak-to-loudness ratio, also referred to as the crest factor, which is the difference between the maximum true peak level value and integrated loudness value.
These numbers help ensure that the track is not being over-limited, also measured over shorter time frames. To be honest, I have only recently started incorporating this in my workflow and I need to experiment more to understand exactly when the numbers are good or bad under which conditions.
That’s all! Well okay, it’s quite a lot and complicated at times. Audio analysis is an important tool to help you stay on track. It’s worthwile to learn and understand at least the metering and phase sections as they are fundamental to a good sound.
If you have any questions, contact me on Instagram @MTwo.Studios or by email, Info@M2Studios.eu.